
Agency Utilization Rate: Formula, Role Targets and Profitability
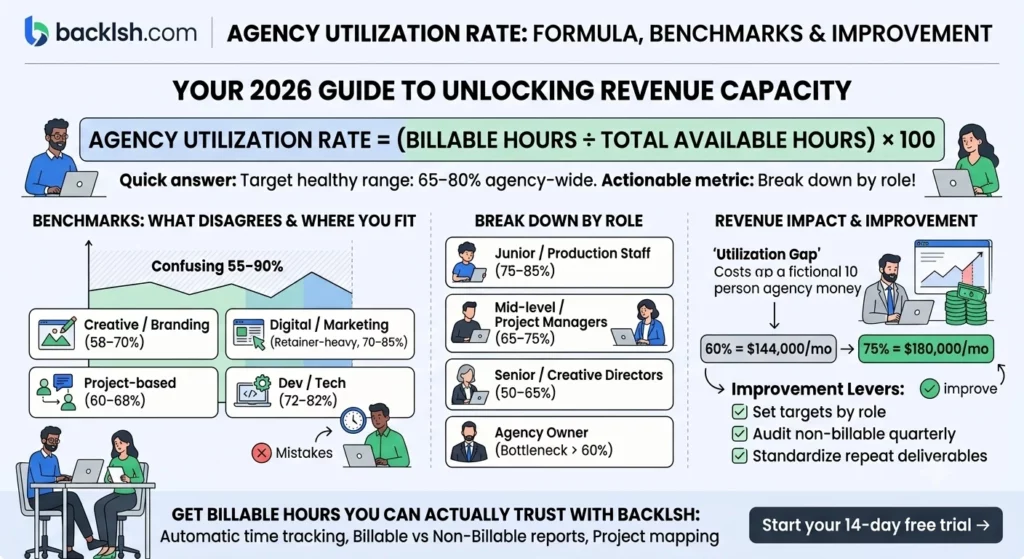
Agency billable utilization rate = billable delivery hours ÷ available working hours × 100. If a team member has 32 available hours after leave and spends 24 on eligible client delivery, their utilization is 75%.
The percentage helps you plan capacity, but it does not tell you whether a client is profitable. To make it useful, define available hours consistently, set targets around each role’s responsibilities, and compare delivery time with revenue and costs.
This guide includes a five-person agency example and a weekly worksheet you can copy into a spreadsheet. All agency figures and role targets below are illustrative planning examples, not measured industry averages.
How do you calculate agency utilization rate?
Start with one person and one reporting period. Establish their scheduled working hours, adjust for unavailable time, and identify eligible client-delivery hours.
- Calculate available capacity: scheduled hours minus approved leave, sickness and public holidays that fall within that schedule.
- Classify delivery time: distinguish eligible client work from internal work, sales, training and out-of-scope work that cannot be charged.
- Divide billable delivery hours by available capacity and multiply by 100.
- Review completeness: resolve missing or overlapping entries before interpreting the result.
For this guide, “billable delivery” means time eligible to be charged under your client agreement, including delivery within an agreed fixed-fee or retainer scope. It does not mean an invoice has already been issued or paid. Track excess revisions and other unrecovered work separately so they remain visible.
Example: a 40-hour schedule minus 8 hours of leave gives 32 available hours. With 24 billable hours, utilization is 24 ÷ 32 × 100 = 75%. Using 40 as the denominator would instead show 60% and hide the effect of leave.
How should part-time schedules, leave and training affect capacity?
Use each person’s actual schedule. A three-day, 24-hour week with one scheduled eight-hour holiday has 16 available hours, not 32. Deduct overlapping leave and holidays once.
In the capacity convention used here, internal meetings, training and business development stay inside available hours and are classified as non-billable work. If you exclude them from the denominator, label that alternative measure and use it consistently; do not compare it directly with this one. Zero available hours should be reported as not applicable rather than dividing by zero.
Billable utilization versus the billable share of logged time
These measures answer different questions. Utilization compares delivery with capacity. Billable share describes the mix of time that was recorded. Teamwork’s reporting documentation explicitly distinguishes their denominators.
| Metric | Formula | Example |
|---|---|---|
| Billable utilization | Billable hours ÷ available hours × 100 | 24 ÷ 32 = 75% |
| Billable share of logged time | Billable hours ÷ all logged hours × 100 | 24 ÷ 28 = 85.7% |
| Time-recording completeness | All logged hours ÷ available hours × 100 | 28 ÷ 32 = 87.5% |
Here, 24 billable plus 4 non-billable hours account for 28 of 32 available hours. Review the four-hour gap before concluding that the person needs more client work. Missing records, unrecorded internal work or genuinely unallocated capacity require different responses.
Keep planned utilization separate too: scheduled billable hours divided by forecast capacity is a forward-looking measure. Compare it with actual delivery to understand cancellations, scope changes and scheduling assumptions.
What is a good agency utilization rate?
There is no single target that fits every agency. As one published reference, Teamwork suggests approximately 70–80% in its agency utilization guidance. Treat that as one provider’s directional range, not a guaranteed profitability threshold or a target for every employee.
Before adopting a benchmark, check its roles, billing model, reporting period and capacity definition. A delivery team and an agency-wide group that includes sales and leadership are different populations.
Should designers, account managers and owners have different targets?
Yes. First reserve time for the work each role is expected to do, then set a billable-hours goal. The examples below demonstrate that process; they are not external benchmarks.
| Role | Available hours | Illustrative billable target | Time reserved for other responsibilities |
|---|---|---|---|
| Designer | 40 | 30 hours / 75% | 10 hours for reviews, training and internal work |
| Developer | 40 | 32 hours / 80% | 8 hours for technical learning and internal support |
| Account manager | 40 | 24 hours / 60% | 16 hours for non-billable coordination and account development |
| Owner | 40 | 12 hours / 30% | 28 hours for sales, hiring, finance and leadership |
Adjust for the contract: some account-management work may be billable. A working owner in a small specialist studio may also deliver more client work than an owner focused on growth. Validate targets against quality, workload and margin over several reporting periods.
Worked example: a five-person agency
Assume the following records cover the same week and all available hours are accounted for as either billable delivery or non-billable work.
| Team member | Scheduled | Leave / holiday | Available | Billable | Non-billable | Utilization |
|---|---|---|---|---|---|---|
| Designer | 40 | 0 | 40 | 30 | 10 | 75.0% |
| Developer | 40 | 8 | 32 | 24 | 8 | 75.0% |
| Copywriter (part-time) | 24 | 0 | 24 | 18 | 6 | 75.0% |
| Account manager | 40 | 0 | 40 | 22 | 18 | 55.0% |
| Owner | 40 | 0 | 40 | 10 | 30 | 25.0% |
| Agency total | 184 | 8 | 176 | 104 | 72 | 59.1% |
Agency utilization = 104 ÷ 176 × 100 = 59.1%. Add hours first, then divide. The simple average of these five percentages is 61%, which incorrectly gives the part-time copywriter the same capacity weight as a full-time person.
The 59.1% total does not prove underperformance. The owner and account manager have different duties from delivery staff. Review individual responsibilities, demand and client economics before changing allocations.
Why can high utilization still produce low profit?
Time spent on client work can increase while revenue stays flat. This is especially important for retainers and fixed-fee projects: more delivery hours do not automatically create more billable revenue.
| Illustrative monthly retainer | Plan | Actual |
|---|---|---|
| Client revenue for the same period | $6,000 | $6,000 |
| Total delivery hours | 60 | 90 |
| Revenue per delivery hour | $100.00 | $66.67 |
| Delivery cost at an assumed $40/hour | $2,400 | $3,600 |
| Contribution before overhead and other costs | $3,600 | $2,400 |
The extra 30 hours reduced contribution by $1,200. Depending on your classification policy, they may increase measured utilization or appear as non-billable overservicing. Either way, include all delivery hours in the client-profitability review.
Pair utilization with these checks:
- Effective revenue per delivery hour: client revenue for the period divided by all associated delivery hours.
- Delivery cost and margin: use a documented cost basis and account for contractors, tools and overhead as appropriate.
- Scope variance: compare agreed effort with actual delivery, including extra revisions.
- Billing recovery: compare invoiced amounts with the value expected under the agreement.
- Collections: monitor cash received and overdue invoices separately from delivered work.
“Realization” is used differently across reporting systems. State whether your figure measures billing recovery or cash collection, and document its denominator. Neither is interchangeable with utilization.
Weekly agency utilization review worksheet
Copy this layout into your spreadsheet. Use one row per person, enter hours as decimals, and define the reporting dates and capacity policy above the table.
| Column | Input or calculation |
|---|---|
| A: Team member | Name or identifier |
| B: Scheduled hours | Actual schedule for this week |
| C: Unavailable hours | Leave, sickness and holidays without double-counting |
| D: Available hours | B − C |
| E: Billable delivery hours | Reviewed time eligible under client agreements |
| F: Non-billable hours | Internal work, sales, training and unrecovered work |
| G: Unreconciled hours | D − E − F |
| H: Utilization | E ÷ D, formatted as a percentage; N/A if D is zero |
| I: Role target | Your agreed planning target |
| J: Follow-up | Cause, action owner and review date |
For the agency total, calculate SUM(E) ÷ SUM(D), not the average of column H. Reconcile negative gaps too: they may represent overtime, duplicate entries or inaccurate capacity assumptions. Do not change actual records simply to make them fit a target.
A practical weekly review
- Confirm leave, schedules and missing time with the team.
- Compare actual delivery with the plan and each role’s target.
- Check clients with high hours, excess revisions or weak revenue per hour.
- Agree one action: rebalance work, clarify scope, remove a blocker or adjust scheduling.
- Record an owner and review date; use several weeks of context for hiring or pricing decisions.
How can you improve utilization without overloading employees?
Start by diagnosing the constraint. Low utilization caused by weak demand needs a different response from low utilization caused by meetings or incomplete timesheets.
- Protect delivery blocks: consolidate avoidable meetings while retaining necessary review and collaboration.
- Match work to available skills: review allocations before adding work to already overloaded specialists.
- Control scope: document revision limits and approve changes before extra delivery becomes routine.
- Preserve development and leadership time: include these responsibilities when setting targets.
- Improve time records: review project assignments and include meetings and offline work. App activity alone does not establish whether work is billable.
- Track outcomes: review quality, deadlines, overtime and contribution alongside utilization.
Read our manual versus automatic time tracking guide and automatic project time tracking guide to improve the inputs. Project records still need your team’s review and contract-specific classification.
Frequently asked questions
Quick answers to common agency utilization questions.
Build your next review from reliable project records. Explore Backlsh for marketing agencies, or use the consultant timesheet guide to organize client work before calculating utilization.